

Once you’ve written a news release, distributed it, and posted it to your newsroom and social media accounts, you have to track results and be able to report ROI.
In the past, we counted outputs and media clips as the ROI of a press release, but in the digital age there is so much more we can track. What do the people who read our releases do as a result? Do they click a link, visit your site or blog, download content or buy the product?
What News Release Measurement Used to Be
Back in 2011 news distribution service, Businesswire, asked 280 PR practitioners with this question: “What is the most important measure of press release success?”
- 32 percent – generating earned media/clips
- 28 percent – general branding/awareness
- 26 percent – driving traffic to our website
- 7 percent – getting link clicks
- 7 percent – other
How to measure News Releases in 2018
What you want to know is what happened as a result of the release you wrote and distributed. It’s the outcome we’re after.
Driving traffic and getting link clicks have to be top of the list now. And that means you have to set a goal for your news releases and put the tracking mechanisms in place, so you can see what people do once they read them.
Measuring Earned Media
- If you use a major wire service, they will give you a report on where the release was distributed.
- A clipping service, like Cision or Meltwater, can tell you where it was published
- If you don’t have a clipping service, you can check online visibility (earned media clips) yourself by doing a Google web search for the headline of the release. Put the entire headline in quotation marks as your search query. This will show you where the release has been picked up and published on other websites. Do it every day for a week and you will see the number increase over time and then start to drop off.
- To find the social media amplification of your release use a social media management dashboard like Sendible.com. You will see where your release has been shared and by whom. Another tool Trendkite, can show you how many shares a release has earned.
- Do a search in Google News for the keywords in the headline and see if the release shows up on page one for that keyword or phrase. This is a good way to check the effectiveness of your optimization. (SEO)
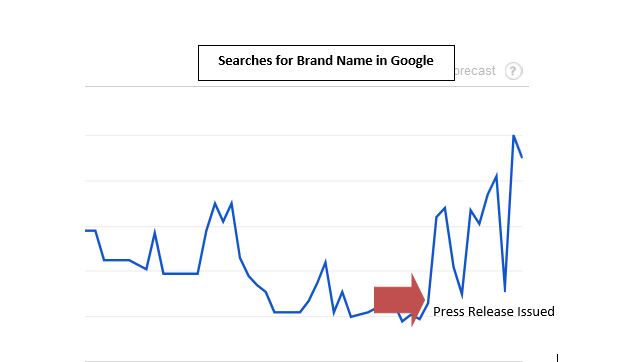
Brand Awareness
You can assess the impact of a news release on brand awareness by the number of brand searches pre- and post-release. Use Google Trends to see this graph.
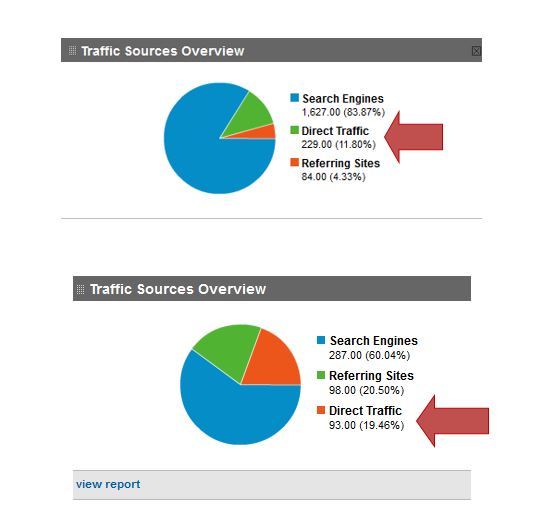
You can also measure brand awareness by looking at the Traffic Sources Overview in the PR Measurement Google Analytics Dashboard. One of the measurements there is Direct Traffic. That means they know your name or URL and typed it into their browser directly.
Note the percentage pre-release and see if it changes once the release has been out for a few days. In this example, the direct traffic went up from 11.80% to 19.46% post-campaign. And as you can see the referring sites also had a big jump – 4.33% to 20.50%
Traffic
Driving traffic is perhaps the easiest to monitor – your PR Measurement Dashboard will show you the number of visitors you have pre- and post-release.
If you see a spike in traffic you can use the analytics program to find where that traffic came from.
In Google Analytics you would
- Adjust the date range so it covers only the day when you got the spike in traffic
- Check the Traffic Sources Overview and see which sector is driving that traffic spike
- It is most likely to be either search engines or referring sites
- Check the Real-time traffic report to see where the influx of visitors is coming from
Links
When you create links in the body of the release, you can use a tracking extension on the URL, so you can track all clicks to the landing page the release links to. You can either use the Google URL Builder tool to do this or, if you use Sendible.com, you can do it right from that dashboard.
Go one step further and track where the traffic comes from. You’ll find this under Referring Sites.

Conversions
If you set goals and put tracking mechanisms in place you can easily see whether you have hit the mark or not. Each release should have a call to action, even if it is only to click a link and read more information on a page in your newsroom or on your website. With Google Analytics you can set up goals and funnels and track visitor behavior once they click that link in the news release.
Other success indicators you can look for are:
- The number of links from other websites and blogs as a result of the news release. You can find this information with the Moz Open Site Explorer.
- Quality/Influence of the websites and blogs linking to you and referring traffic, www.Similarweb.com will give you all sorts of information about other websites.
- Which referring sites send you the most traffic.
- Influence of the people tweeting about your release. You can use their Klout Score and cross-reference that with Peer Index, to get a more reliable number. If you use Sendible this data will be available in your dashboard.
- If the release has a specific call to action, such as ‘download a whitepaper’ or ‘watch a video’, track the number of people who take that action. You will have to set up these goals in the Dashboard. Once that’s done you can see how your content is performing at a glance with the Outcomes by Page report.
- You should also track how your social content is driving traffic back to your website, blog or newsroom using the social sessions and networks report in the PR Measurement Dashboard.
In the digital age, where every click can be tracked, it is possible to track PR outcomes, not just outputs.
In 2018 measurement and analytics are in high demand. The C-suite wants to know how effective their marketing and PR is, and how it contributes to the bottom line. It’s up to you to prove the value of your work.
![]()